The days of smartphones with physical keyboards and styluses are long gone, and so too are the days where few people could afford the expensive mobile plans. Nowadays, dozens of mobile phone brands are available on the market, with Chinese companies quickly developing budget smartphones that can easily take on well-established and more expensive iPhones or Galaxy models.
Despite the impressive growth of relative newcomers such as Huawei, Xiaomi, and Oppo, sales figures for 2023 reveal the persistent global monopoly of Apple and Samsung. These two phone makers are responsible for all the Top 10 best-selling smartphones in the world for the first six months of this year. While they seem to remain the undisputed industry leaders globally, other companies have managed to secure a larger share of the market in certain regions. Our team at JohnsPhones decided to check which brands dominate the local markets around the world. We looked at the latest mobile phone brand market share in 65 countries and created a map of the most popular phone brands.

Vendor market share as of October 2023
| Country | #1 Brand | #1 Market Share | #2 Brand | #2 Market Share | #3 Brand | #3 Market Share |
|---|---|---|---|---|---|---|
| Australia | Apple | 61.42% | Samsung | 25.25% | 2.98% | |
| Austria | Apple | 45.11% | Samsung | 32.74% | Xiaomi | 6.15% |
| Belgium | Apple | 48.53% | Samsung | 31.70% | Xiaomi | 5.69% |
| Canada | Apple | 60.66% | Samsung | 24.92% | 3.90% | |
| Chile | Samsung | 33.22% | Apple | 22.61% | Xiaomi | 15.15% |
| Colombia | Apple | 24.75% | Samsung | 24.67% | Xiaomi | 19.46% |
| Costa Rica | Samsung | 32.70% | Apple | 24.35% | Huawei | 9.94% |
| Czech Republic | Apple | 29.29% | Samsung | 25.18% | Xiaomi | 20.71% |
| Denmark | Apple | 69.33% | Samsung | 16.59% | OnePlus | 4.15% |
| Estonia | Apple | 40.07% | Samsung | 29.77% | Xiaomi | 11.16% |
| Finland | Apple | 35.55% | Samsung | 28.25% | Xiaomi | 9.78% |
| France | Apple | 36.15% | Samsung | 28.86% | Xiaomi | 11.97% |
| Germany | Apple | 39.97% | Samsung | 33.32% | Xiaomi | 9.41% |
| Greece | Xiaomi | 35.29% | Samsung | 31.81% | Apple | 10.50% |
| Hungary | Samsung | 37.63% | Xiaomi | 20.77% | Apple | 20.74% |
| Iceland | Apple | 56.47% | Samsung | 31.08% | Xiaomi | 3.61% |
| Ireland | Apple | 46.43% | Samsung | 33.58% | Unknown | 4.01% |
| Israel | Samsung | 49.35% | Apple | 24.59% | Xiaomi | 17.94% |
| Italy | Apple | 33.42% | Samsung | 28.56% | Xiaomi | 13.60% |
| Japan | Apple | 70.23% | Unknown | 6.69% | Samsung | 6.45% |
| South Korea | Samsung | 67.72% | Apple | 27.12% | LG | 2.04% |
| Latvia | Samsung | 40.36% | Apple | 27.36% | Xiaomi | 15.73% |
| Lithuania | Samsung | 37.29% | Apple | 27.56% | Xiaomi | 18.02% |
| Luxembourg | Apple | 35.17% | Samsung | 26.03% | Xiaomi | 11.13% |
| Mexico | Samsung | 23.85% | Apple | 22.60% | Motorola | 15.62% |
| Netherlands | Apple | 45.01% | Samsung | 34.20% | Xiaomi | 4.81% |
| New Zealand | Apple | 44.11% | Samsung | 33.20% | Oppo | 5.87% |
| Norway | Apple | 66.79% | Samsung | 21.48% | Huawei | 2.18% |
| Poland | Samsung | 33.75% | Xiaomi | 23.83% | Apple | 14.43% |
| Portugal | Apple | 33.53% | Samsung | 29.99% | Xiaomi | 16.52% |
| Slovakia | Samsung | 30.64% | Apple | 24.67% | Xiaomi | 21.14% |
| Slovenia | Samsung | 40.01% | Apple | 26.88% | Xiaomi | 10.41% |
| Spain | Xiaomi | 27.68% | Samsung | 26.69% | Apple | 23.67% |
| Sweden | Apple | 56.12% | Samsung | 29.52% | Xiaomi | 2.89% |
| Switzerland | Apple | 56.73% | Samsung | 27.46% | Xiaomi | 3.79% |
| Turkey | Unknown | 36.23% | Samsung | 20.09% | Apple | 18.94% |
| United Kingdom | Apple | 53.10% | Samsung | 29.16% | 3.18% | |
| United States | Apple | 56.64% | Samsung | 26.64% | Unknown | 4.51% |
| Brazil | Samsung | 37.58% | Motorola | 19.33% | Apple | 17.90% |
| China | Unknown | 25.25% | Apple | 23.40% | Huawei | 22.66% |
| India | Xiaomi | 20.29% | Vivo | 17.89% | Samsung | 14.03% |
| Indonesia | Oppo | 17.04% | Samsung | 16.54% | Xiaomi | 14.82% |
| South Africa | Samsung | 50.23% | Apple | 16.64% | Huawei | 15.37% |
| Pakistan | Samsung | 17.92% | Vivo | 13.89% | Infinix | 13.67% |
| Nigeria | Tecno | 26.49% | Infinix | 20.80% | Samsung | 11.91% |
| Bangladesh | Samsung | 19.69% | Xiaomi | 18.75% | Vivo | 12.09% |
| Russia | Apple | 30.30% | Xiaomi | 22.06% | Samsung | 18.86% |
| Ethiopia | Samsung | 46.70% | Tecno | 17.85% | Infinix | 9.34% |
| Philiippines | Oppo | 15.06% | Vivo | 14.05% | Samsung | 13.29% |
| Egypt | Samsung | 25.57% | Oppo | 17.30% | Apple | 14.48% |
| Saudi Arabia | Apple | 37.08% | Samsung | 22.18% | Xiaomi | 7.43% |
| Kenya | Samsung | 22.36% | Tecno | 19.02% | Unknown | 14.17% |
| DR Congo | Tecno | 32.58% | Unknown | 13.14% | itel | 11.88% |
| Vietnam | Apple | 38.42% | Samsung | 24.97% | Oppo | 15.05% |
| Thailand | Apple | 35.51% | Samsung | 18.83% | Oppo | 13.27% |
| Iran | Samsung | 52.47% | Xiaomi | 27.60% | Apple | 8.14% |
| Romania | Samsung | 44.11% | Apple | 25.27% | Xiaomi | 8.29% |
| Argentina | Samsung | 50.03% | Motorola | 26.38% | Apple | 10.19% |
| Uganda | Tecno | 26.22% | Samsung | 20.26% | Unknown | 16.09% |
| Algeria | Samsung | 27.43% | Xiaomi | 21.80% | Oppo | 15.18% |
| Peru | Samsung | 32.60% | Xiaomi | 21.73% | Apple | 10.64% |
| Uzbekistan | Samsung | 30.59% | Xiaomi | 25.38% | Unknown | 22.39% |
| Malaysia | Apple | 29.61% | Samsung | 14.54% | Oppo | 12.55% |
| Bulgaria | Samsung | 37.71% | Xiaomi | 18.96% | Apple | 14.86% |
| Morocco | Samsung | 36.32% | Xiaomi | 18.45% | Apple | 16.84% |
The Most Popular Phone Brands Around the World as of October 2023
Apple and Samsung are the clear mobile phone market leaders, if we are looking at global figures at least. However, when it comes to regional and local markets, the data paints a more diverse picture. According to October 2023 figures from Statcounter Global Stats, Xiaomi, and Oppo are the top smartphone makers in terms of market share in certain countries. Still, Apple is the top brand globally, with a market share of 29.64% for the month of October, and Samsung is close behind with 24.68% of the market.
Of the 65 countries our team reviewed, Apple has the largest market share in 29 countries, including Australia (61.42%), Japan (70.23%), Iceland (56.47%), Russia (30.3%), the United Kingdom (53.10%), and the United States (56.64%). Its rival Samsung, on the other hand, takes the top position in 26 countries, including Israel (49.35%), Mexico (23.85%), Poland (33.75%), and its home country of South Korea, where it accounts for 67.72% of the market.
Out of the 65 countries we examined, Xiaomi is the most represented brand in Greece, Spain, and India. In Greece, in particular, its devices account for 35.29% of the market; in other words, more than one in three smartphones in the country were made by this Chinese company. Back in 2021, a Canalys analysis showed that, for the second quarter of that year, Xiaomi overtook Apple as the smartphone vendor shipping the largest amount of devices after Samsung. However, this success was short-lived, and today the Chinese brand accounts for only 10.98% of the global market.
Another popular electronics manufacturer from China, Oppo, has cemented its position among the top phone brands around the world. Established back in 2004, it has grown to be one of the largest smartphone vendors in Asia, and according to the October 2023 data we reviewed, it was the top phone brand in Indonesia and the Philippines, with market shares of 17.04% and 15.06% respectively. Interestingly, the top vendor in China was listed as “unknown” but there is a great likelihood that at least some of the 25.25% market share is actually held by Oppo and its subsidiaries Realme and OnePlus.
Tecno Mobile, yet another Chinese vendor, emerges as the top smartphone brand in Uganda (26.22%) and the Democratic Republic of Congo (32.58%). It is also the biggest name in Nigeria where its presence translates to 26.49% of the market, followed by Infinix (20.80%), and Samsung (11.91%). Tecno and Infinix are subsidiaries of Transsion Holdings, which also owns itel Mobile.

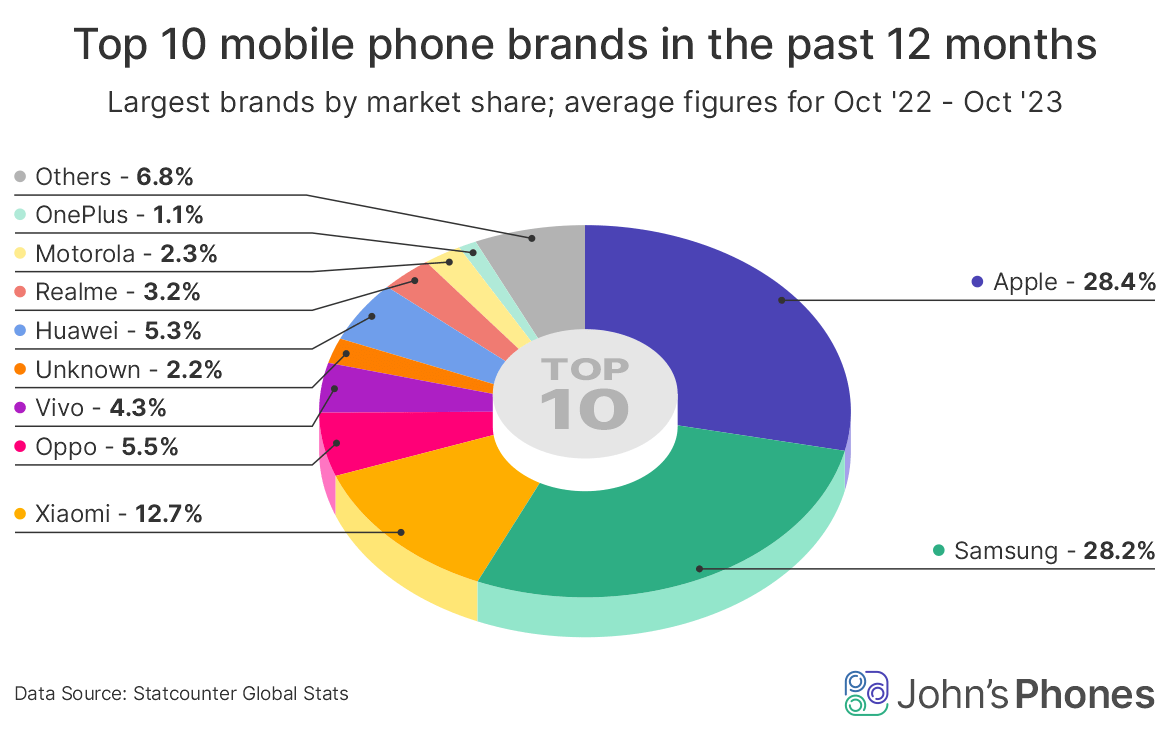
Over the past 12 months, Apple and Samsung have been the biggest phone brands around the world, having a nearly identical share of the market when we consider average figures for the entire period. Apple leads with 28.4% of the market, while Samsung has 28.2%, followed by Xiaomi with 12.7%, Oppo with 5.5%, Huawei with 5.3%, Vivo with 4.3%, Realme with 3.2%, and Motorola with 2.3%.

The World’s Best-Selling Smartphones in the First Half of 2023
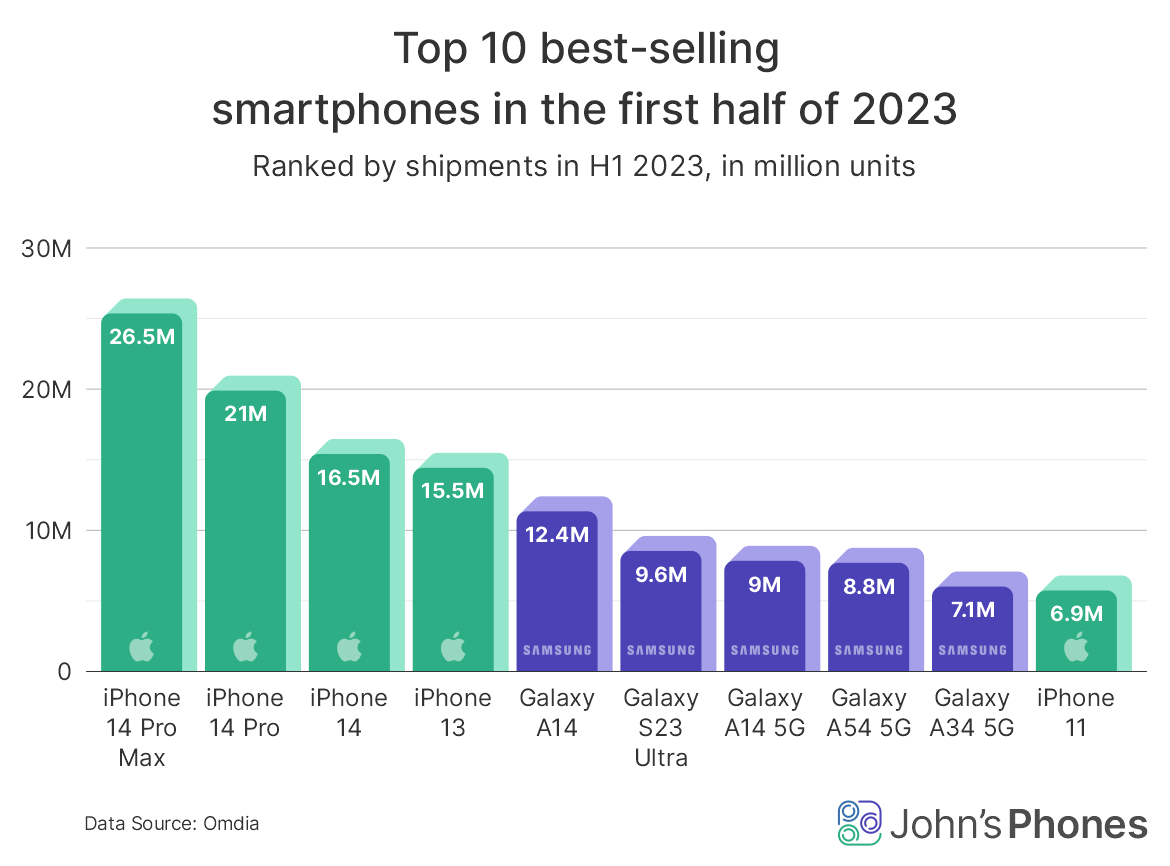
Just a few months before the arrival of the iPhone 15, which launched in September 2023, last year’s smartphone lineup by Apple took the top three positions as the best-selling models globally. According to figures released by technology research firm Omdia, Apple’s iPhone 14 Pro Max was the most popular smartphone in the world with 26.5 million units shipped in the first six months of 2023.
Until it was discontinued in September, the iPhone 14 Pro Max was the most expensive model offered by Apple at an initial price range of $1,099 – $1,599 (£1,199 – £1,749). Now its successor, the iPhone 15 Pro Max, starts at $1,199, with the 128GB version being dropped from the lineup. Whether that price change affects the sales of the new model remains to be seen.
The Cupertino-based company has three more phones in second, third, and fourth positions. These are the iPhone 14 Pro (2nd place) and iPhone 14 (3rd place), with 21 million and 16.5 million units shipped respectively during the first half of the year. The fourth-best selling model was the iPhone 13, with 15.5 million units shipped in that period.
The next five smartphones on this ranking are all Samsung’s Galaxy models: the Galaxy A14, Galaxy S23 Ultra, Galaxy A14 5G, Galaxy A54 5G, and Galaxy A34 5G. The Galaxy A14 is the latest generation smartphone by the South Korean electronics giant. It is the more affordable, 4G version of the Galaxy A14 5G, and despite its overall lower performance and fewer capabilities, it is the more popular model of the two.
Overall, both the Galaxy A14 and Galaxy A14 5G and are budget phones unlike the device that comes next in our ranking, the Galaxy S23 Ultra, which is the latest high-end Galaxy model released in February of 2023. Samsung’s mid-range phones from this year are also on the list, the Galaxy A54 5G and Galaxy A34 5G. The tenth position is held by yet another smartphone by Apple, namely the iPhone 11, which was released back in September 2019.
It is clear that the best-selling phones so far this year are from just two companies. However, this year Xiaomi’s Redmi Note 11 and Redmi 9A hold 9th and 10th position on that list, alongside the more expected devices from Apple and Samsung.

The Best-Selling Smartphone Vendors in Q3 2023
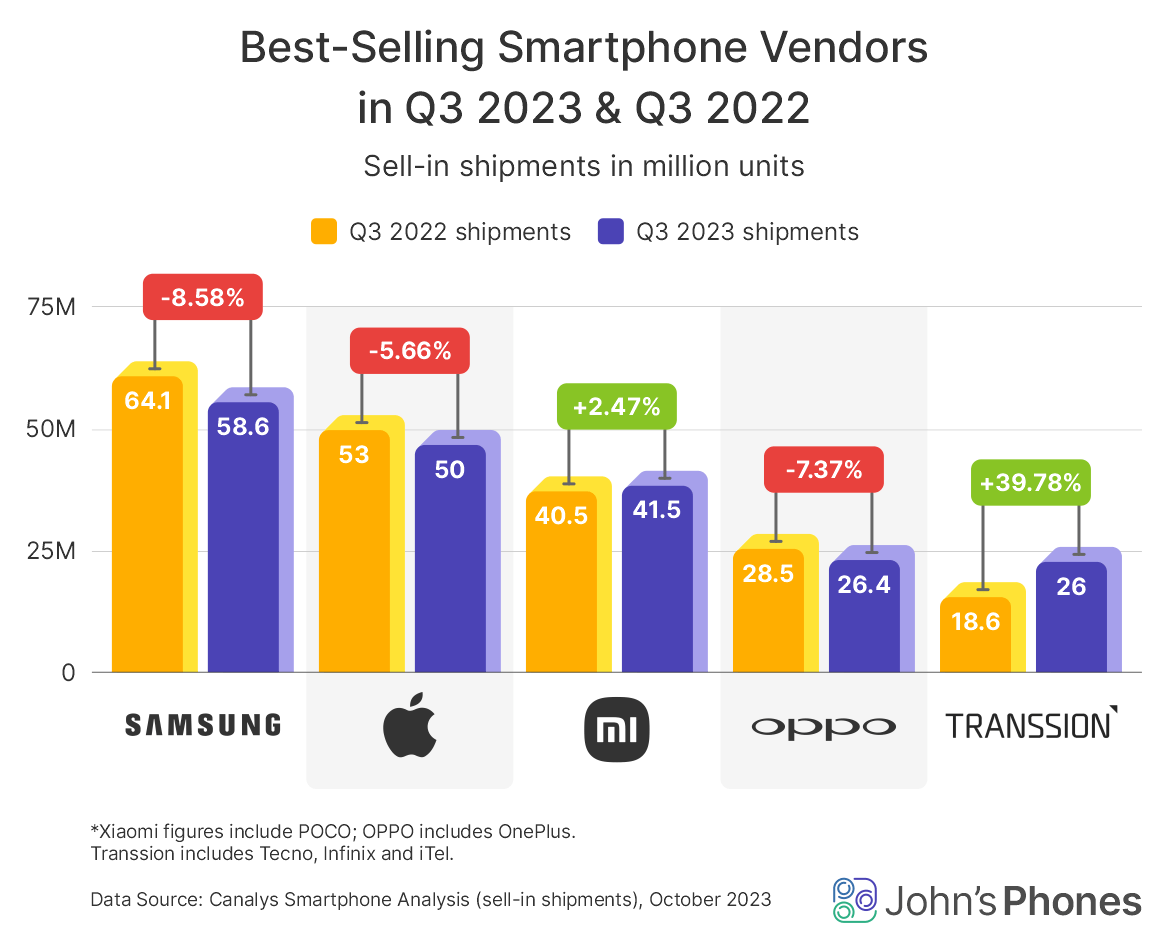
The global smartphone market shrank year-over-year by 1% in the third quarter of 2023, to 294.6 million devices shipped, according to the latest data by technology market analysts at Canalys. With 58.6 million units, equivalent to a roughly 20% market share, Samsung was the top-selling vendor in Q3, followed by Apple, which shipped around 50 million phones, gaining a 17% market share.
Both companies released their latest-generation smartphones before the end of the third quarter of this year, so the sales were driven by strong demand for the new lineups. Interestingly enough, Apple still managed to ship huge volumes despite its newest phones launching at the end of the quarter. We can see an impressive performance from Xiaomi as well, which shipped 41.5 million devices in that period. It managed to attract customers with several premium 5G-enabled phones being released over the past few months, namely the Redmi K60 Ultra, Xiaomi Civi 3, Xiaomi 13 Ultra, Redmi Note 12T Pro, and Redmi 12 5G.
OPPO (including OnePlus) is in fourth place with 26.4 million units of sell-in shipments (9% market share), while Transsion Group, with its Tecno, Infinix, and itel brands, maintains its place in fifth position, shipping roughly 26 million units in the third quarter of 2023. In fact, Transsion is the only vendor that saw its global shipments increase significantly year-over-year, up 40% from Q3 of 2022.
Predictions for Q4 2023, market changes and upcoming trends in 2024
The forecast for Q4 2023 is an overall increase of around 7.3% YoY growth, especially for Chinese Original Equipment Manufacturers (OEMs), since they released many new products during Q4. The general market recovery is expected to continue in 2024 with about 3.8% growth. The only companies to score double-digit annual growth this year were predominantly Chinese (Huawei, Tecno, HONOR, Transsion and Motorola).
At the end of Q3 2023 the top three smartphone market share vendors haven’t had any drastic changes: Apple still peaks, as the leading manufacturer with 28.8%, Samsung closely follows with 24.15% and Xiaomi is third with 11.99%. However the trends throughout 2023 are setting foundations for an interesting 2024.
Reported by ‘Jefferies’ Apple has seen a 30% drop of sales in China for the first week of 2024. The result is derived from the 3% YoY decline throughout 2023 in the country, as well as the new Huawei Mate 60 series that launched in August and quickly gained popularity as a favorable contender.
The segment of premium phones (wholesale price ≥$600) has surprisingly increased over 2023 with a 6% overall growth, regardless of the 1% YoY decline in smartphone sales throughout the year. Although Apple is still the indisputable leader in premium phones with a share of 71%, their lead has declined from 75% in 2022, due to the new Android contestants, again the Huawei Mate 60 and Samsung’s Galaxy S23 foldable phone.
Another movement to lookout for in 2024 and the years to come is the upcoming wave of foldable phones. Despite the fact that in Q2 2023 there was a decline in smartphone sale worldwide, the foldable phone sector actually rose in demand with 10% throughout this period. China in particular struck 68% increase YoY with 1.2 million units, making it the leader in the foldable smartphone market with a total of 58.6% share, according to Counterpoint Research.
The market for such devices is expanding rapidly and this interest is forecasted to continue over 2024. Samsung along with Huawei are the leading vendors in this segment, however Chinese-based companies are becoming more adaptable, offering a wider range of products with many features from entry-level foldables (600$-700$) to ultra-premium ones (over 1000$), making them even more competitive.
Methodology
To get up-to-date data on mobile phone vendor market share (globally and country-specific), the team at XXXX looked at the October 2023 figures released by web analytics firm StatCounter. It tracks Internet usage from different mobile devices, and its data is based on more than 15 billion page views per month on its network of over three million websites. We also analyzed the figures for the 12 months ending in October 2023.
For the best-selling mobile brands in the third quarter of 2023, we sourced data from technology market analysis firm Canalys and its smartphone analysis of global sell-in shipments, which was released in October. Note that the Xiaomi stats include figures for the POCO lineup of phones, while the information about OPPO includes OnePlus. Additionally, Tecno, Infinix, and itel figures are included in the Transsion data.
We also used the latest data for the most shipped smartphone models by technology research firm Omdia, which includes the number of shipped units globally for the first six months of 2023.
